Table Of Contents
- Installation of System Center Operations Manager 2012 R2
- Installation Of Agents On Clients/Servers using System Center Operations Manager 2012
- Email Notification System Center Operations Manager 2012
- Setting up My Workspace System Center Operations Manager 2012
- Disable a Monitor or Rule using Overrides System Center Operations Manager 2012
- Create a Report and Schedule using System Center Operations Manager 2012
- Create and Monitor Custom Service using System Center Operations Manager 2012
Monitor a Custom Windows Service
- Within the SCOM console, Navigate to the ‘Authoring’ tab, expand ‘Management Pack Objects’ and select ‘Monitors’
2. Right click on ‘Monitors’, expand ‘Create a Monitor’ and select ‘Unit Monitor…’
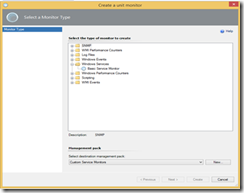
3. Expand ‘Windows Services’ and select ‘Basic Service Monitor’
4. From the drop-down menu, select the management pack that you wish to place this monitor into. For custom monitors I create a management pack which i have called ‘Custom Service Monitors. Then click ‘Next’
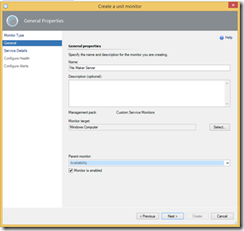
5. Give your monitor a name that is unique and specific to what you are monitoring; I called mine ‘File Maker Server’
6. Select a monitor target. if this service is specific to an operating system such as Server 2008 R2, then search for and select ‘Windows Server 2008 R2 Computer’ of the Discovery management pack. Otherwise select ‘Windows Computer’ to cover all Windows server and clients. Then click ‘Next’
7. Select a ‘Parent monitor’ from the drop-down box. for custom monitors I create an Aggregate Rollup Monitor which is called ‘Custom Services’. If you have not got a custom one, select ‘Availability’, it can always be changed later
8. Because this service is only on one server, I do not want the monitor enabled by default. Untick ‘Montor is enabled’, then click ‘Next’
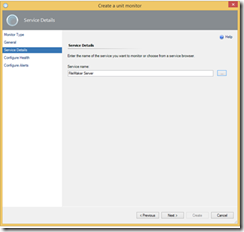
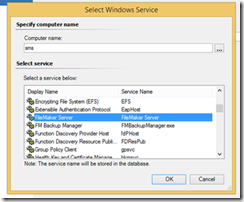
9. If you are confident of the service name then type it in the box. I strongly suggest clicking on the ‘…’ button
10. Locate the service you wish to monitor and click ‘OK’. When you use this method there can be no doubt as to the service name
11. Click ‘Next’
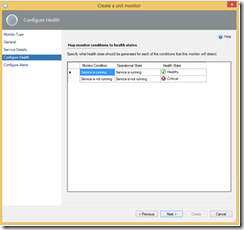
12. The default health states are fine for monitoring services, so unless you have specific requirements for something different, click ‘Next’
13. I turn on alerts for all service monitors, select ‘Generate alerts for this monitor
14. Change the ‘Alert description’ to something that makes sense for you, mine is ‘File Maker’ Service has stopped.”
15. Click ‘Create’
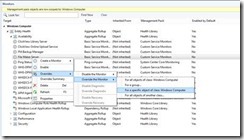
16. Search ‘Monitors’ for your monitor locate it under ‘Windows Computer’. Right click, expand ‘Overrides’, then ‘Override the Monitor’. Select ‘For a specific object of class: Windows Computer’
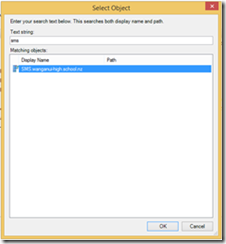
17. Search for the server that is running the service, select the server and click ‘OK’
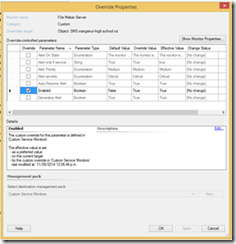
18. Tick the ‘Override’ box that corresponds to the ‘Enabled’ parameter, then change the ‘Override Value’ to ‘True’. Click ‘OK’
19. Navigate to the ‘Monitoring’ tab, then select ‘Windows Computers’
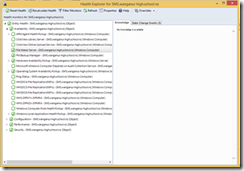
20. Search for the server you just created the override for. Right click on the server, expand ‘Open’, select ‘Health Explorer’ for your server
21. Navigate to where you placed the monitor, in my case it was ‘Availability’. Depending on your setup, you may have to clear the filter, it will be a yellow bar at the top of the left pane
22. Click on State Change Events to confirm when the monitor became active. It could take up to 30 minutes for the monitor to become active. This is dependent on the amount of clients you are monitoring and the performance of your SCOM infrastructure.


