Table Of Contents
- Installation of System Center Operations Manager 2012 R2
- Installation Of Agents On Clients/Servers using System Center Operations Manager 2012
- Email Notification System Center Operations Manager 2012
- Setting up My Workspace System Center Operations Manager 2012
- Disable a Monitor or Rule using Overrides System Center Operations Manager 2012
- Create a Report and Schedule using System Center Operations Manager 2012
- Create and Monitor Custom Service using System Center Operations Manager 2012
How to Create a Report and Scheduling It
- In the Operations console, click Monitoring
2. In the Monitoring workspace, expand Monitoring and then click Windows Computers.
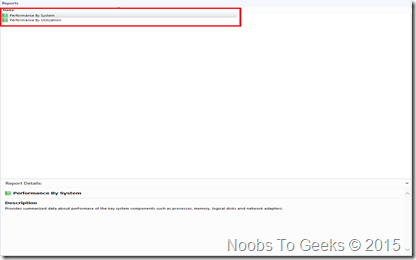
3. In the Reports selection choose one instance.
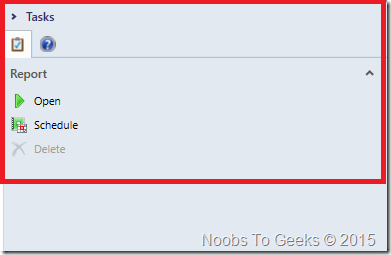
4. Click open or you can Schedule.
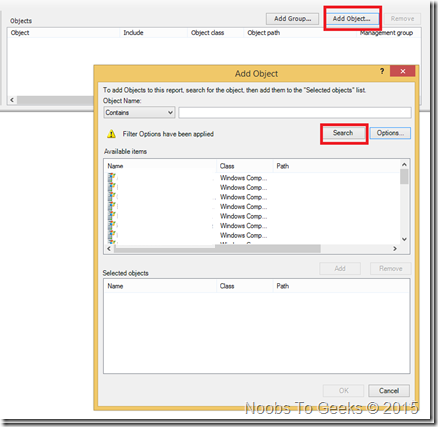
5. Click on Objects to add computers and click search to find computers from the group. Choose the computers and click Add.
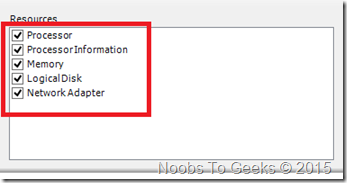
6. Choose the resources you want to display in the report
7. In the Parameter Area, click the down arrow in the From box and then click Yesterday. (Choose the option that best suits your needs.)
8. Click the down arrow on the Aggregation Type list, and click the value you want for this report.
9. Click Run to display the Alert Logging Latency Report
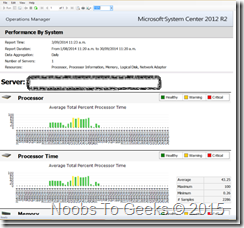
10. Report is generated as shown.
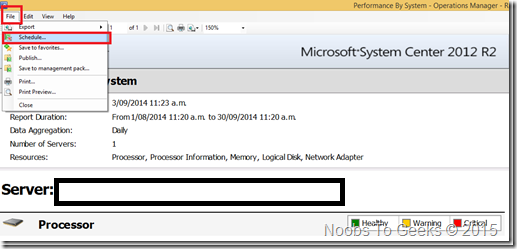
11. Click on Schedule, a dialog box will appear and give a description.
12. Choose a Delivery method.
13. Click Finish to Schedule.
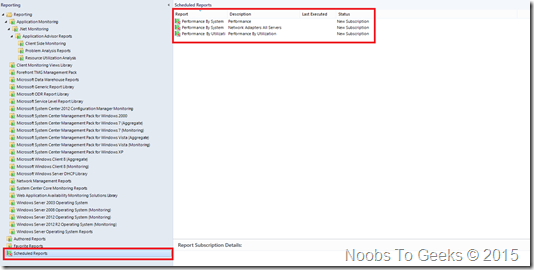
14. Click on Schedule Reports pane on left hand side to view the Schedule reports.
How to Create an Alert Logging Latency Report
To create an alert logging latency report
1. Log on to the computer with an account that is a member of the Operations Manager Administrators role.
2. In the Operations console, click Monitoring.
3. In the Monitoring workspace, expand Monitoring and then click Windows Computers.
4. In the Windows Computers pane, click a row with a Health Service instance.
5. In the Tasks pane, under Report Tasks, click Alert Logging Latency.
6. In the Parameter Area, click the down arrow in the From box and then click Yesterday.
7. You can further specify the timeframe for the report in the additional options in the Parameter Area.
8. Click the down arrow on the Threshold list, and select the latency threshold you want to measure.
9. Click the down arrow on the Aggregation Type list, and click the value you want for this report.
10. Click Run to display the Alert Logging Latency Report.
11. Click Close to close the report.
How to Create an Alerts Report
1. Log on to the computer with an account that is a member of the Operations Manager Administrators role.
2. In the Operations console, click Monitoring.
3. In the Monitoring workspace, expand Monitoring, and then click Wndows Computers.
4. In the Windows Computers pane, click a row with a Health Service instance.
5. In the Tasks pane, under Report Tasks, click Alerts.
6. In the Reporting Parameter area, click the down arrow in the From box and then click Yesterday.
7. You can further specify the timeframe for the report in the additional options in the Reporting Parameter area.
8. Click Run to display the Alert Report.
9. Click Close to close the report.
How to Create an Availability Report
The availability report provides the following information about the selected computers:
· Down – computer state is critical (red)
· Up – computer state is healthy (green)
· Yellow – computer state is warning (yellow)
· Unmonitored – computer or monitor did not exist during reporting period
· Monitor disabled – monitor has been disabled, such as by using an override
· Monitoring unavailable – the System Center Management Health service monitoring the computer is unavailable
· Planned/unplanned maintenance – computer is in maintenance mode; overrides all other states
To create an availability report
1. Log on to the computer with an account that is a member of the Operations Manager Administrators role.
2. In the Operations console, click Monitoring.
3. In the Monitoring workspace, expand Monitoring, and then click Windows Computers.
4. In the Windows Computers pane, click the row, or rows, that represent the computer for which you want to run an availability report.
5. In the Tasks pane, under Report Tasks, click Availability.
6. In the Report view, in the Parameter area, click the down arrow in the From box, point to This week, and then click Sunday.
7. Click the down arrow in the To box, point to This week and then click Saturday.
8. Click Use business hours.
9. You can further specify the timeframe for the report in the additional options in the Parameter area.
10. When you have specified the timeframe for the report, click Run to display the Availability Report.
11. For a more detailed report, such as a report showing a graph for every day, click the horizontal bar graph under Availability Tracker.
12. In the tool bar, click View, point to Go To, and then click Back to Parent Report to return to the original report.
13. Click Close to close the report.
How to Create a Configuration Changes Report
1. Log on to the computer with an account that is a member of the Operations Manager Administrators role.
2. In the Operations console, click Administration.
3. Click Settings.
4. Under Agent, double-click Heartbeat.
5. Change the agent Heartbeat Interval from its default value of 60 seconds to 120 seconds, and click OK.
6. In the Operations console, click Monitoring.
7. In the Monitoring workspace, expand Monitoring, and then click Windows Computers.
8. In the Windows Computers pane, click a row containing a Health Service instance.
9. In the Tasks pane, under Report Tasks, click Configuration Changes.
10. In the Reporting Parameter area, click the down arrow in the From box, and then click Yesterday.
11. You can further specify the timeframe for the report in the additional options in the Reporting Parameter area.
12. In the Reporting Parameter area, under Monitoring Object, click Add.
13. In the Add Object dialog box, in the Object Name list, click the down arrow and then click Begins with.
14. In the Object name text box, type the computer name for the computer you selected in step 5, and then click Search.
15. In the Available items list, click the computer with the Type of Health Service, click Add, and then click OK.
16. In the Reporting Parameter area, in the Monitoring Object list, click the entry that is not of the type Health Service, and then click Remove.
17. Click Run to display the Configuration Changes Report.
18. Click Close to close the report.
How to Create an Event Analysis Report
To create an event analysis report
1. Log on to the computer with an account that is a member of the Operations Manager Administrators role.
2. In the Operations console, click Monitoring.
3. In the Monitoring workspace, expand Monitoring, and then click Windows Computers.
4. In the Windows Computers pane, click a row containing a Health Service instance.
5. In the Tasks pane, under Report Tasks, click Event Analysis.
6. In the Reporting Parameter area, click the down arrow in the From box, and then click Yesterday.
7. You can further specify the timeframe for the report in the additional options in the Reporting Parameter area.
8. In the Reporting Parameter area, under Monitoring Object, click Add.
9. In the Add Object dialog box, in the Object Name list, click the down arrow, and then click Begins with.
10. In the Object name text box, type the computer name for the computer you selected in step 4, and then click Search.
11. In the Available items list, click the computer with the Type of Health Service, click Add, and then click OK.
12. In the Reporting Parameter area, in the Monitoring Object list, click the entry that is not of the type Health Service, and then click Remove.
13. Click Run to display the Event Analysis Report.
14. Click Close to close the report.
How to Create an Operational Data Report
1. To create a Microsoft ODR Report
2. Log on to the computer with an account that is a member of the Operations Manager Report Operators role.
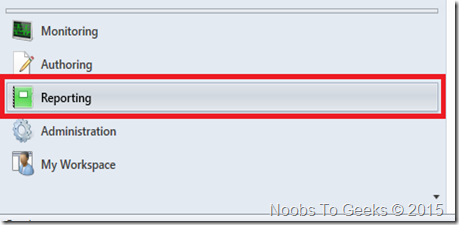
3. In the Operations console, click Reporting.
4. In the Reporting workspace, expand Reporting, and then click Microsoft ODR Report Library.
5. In the Reports pane, right-click one of the reports (for example, Management Packs), and then click Open.
6. In the Report view, in the Parameter area, click the down arrow in the From box, point to This week, and then click Sunday.
7. Click the down arrow in the To box, point to This week, and then click Saturday.
8. Click Run to display the ODR Report.
9. Click Close to close the report.
